Statistics Tables (Enterprise)
Overview
Statistics tables are designed for grouped summaries. They are available for Enterprise tables and are useful when you need totals, averages or ranges by category.
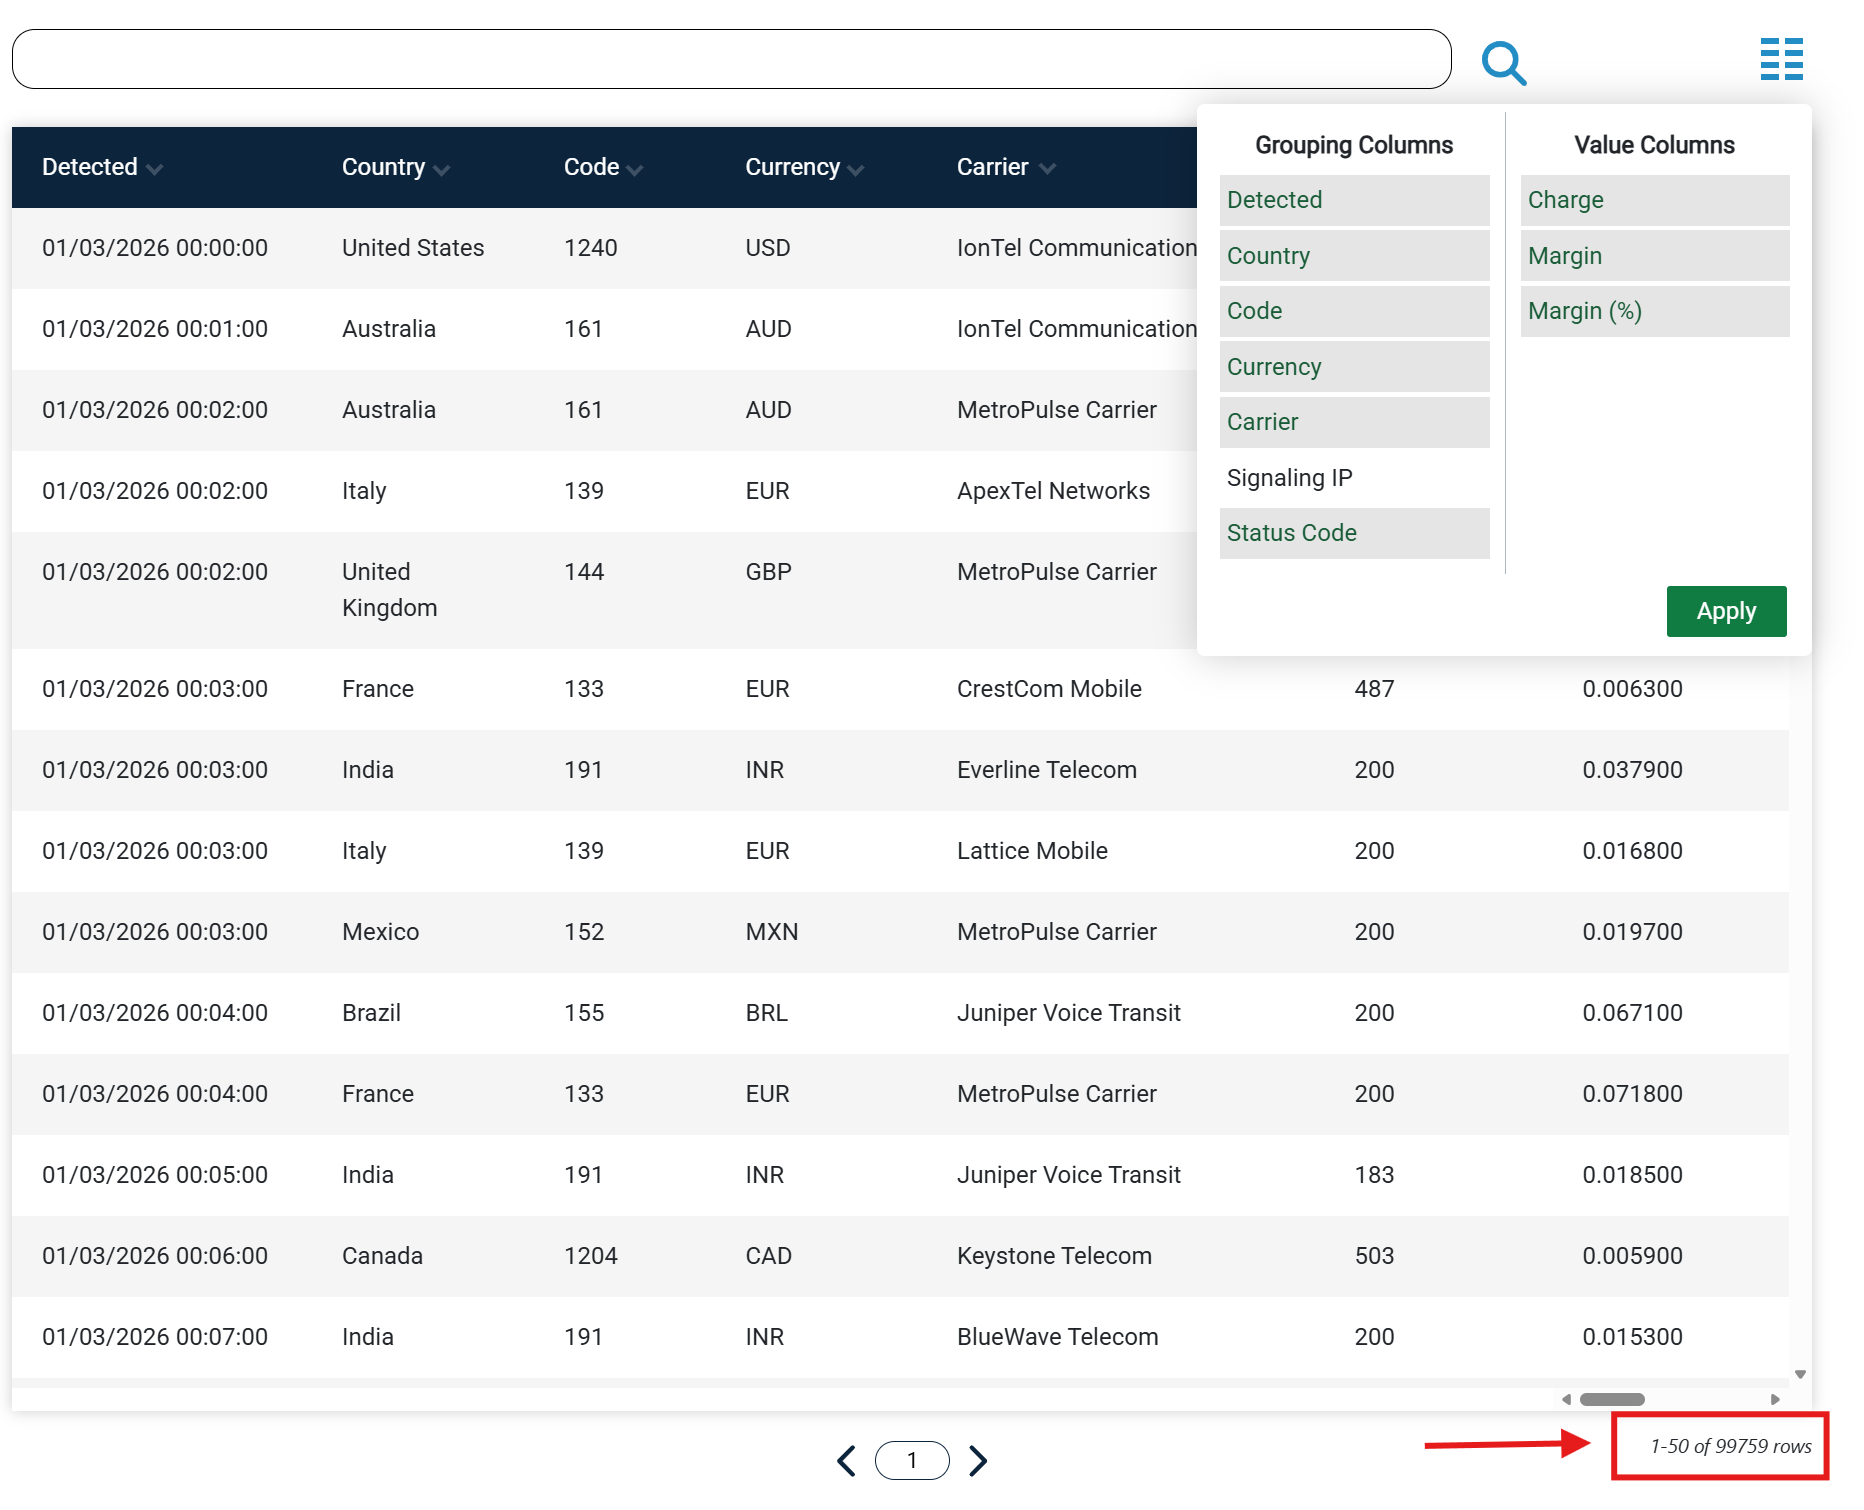
Grouping Columns And Value Columns
In a statistics table, you choose grouping columns and value columns. Grouping columns define each row group, and value columns are the fields that get aggregated.
At least one grouping column is required. The Apply action in the statistics column picker updates which columns are grouped, aggregated or hidden.
Aggregation Options
You can choose per-column aggregation options such as Sum, Average, Maximum, Minimum, Range and Separator. The available output depends on the column data type.
Important Behaviour
Statistics tables use async queries so filtering, sorting, grouping and paging can run on the server. This keeps larger grouped reports responsive.
If a non-Enterprise user edits a statistics table, the table may be saved as Dynamic instead. For this reason, statistics tables are best managed with Enterprise access.